Navigation : Home : FoveaPro : FoveaPro Tutorial : Part 14
Image Analysis Cookbook 6.0: Part 14
4.A.4. Contour lines (iso-brightness lines)
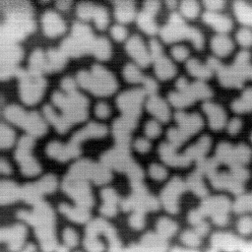
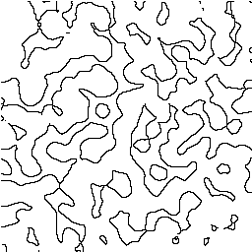
Contour lines provide an alternative to conventional thresholding. Rather than selecting a range of pixel values, they mark boundaries between such ranges. Contours are continuous lines that often correspond to physical boundaries, and can be used to measure them. For a range image in which brightness represents elevation, the contour line is an is elevation line and can be used to generate a topographic contour map.
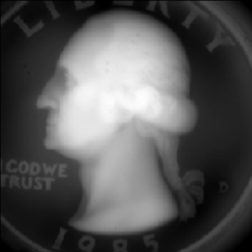
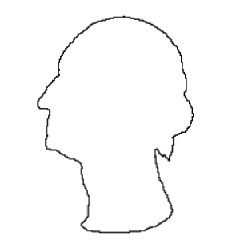
Original Quarter image A single contour line
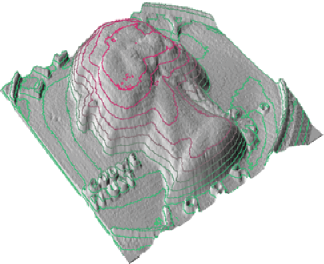 Multiple colored contour lines superimposed on a rendered, Phong shaded surface representation. (The sequence used to produce this graphic was recorded in an
action; details are available on the DrJohnRuss.com website)

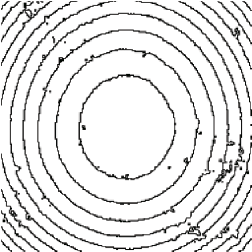
Original Ball bear image (range image) Multiple contour lines showing roughness and out-of-round
As will be covered in Section 6.B.2. on stereology, the surface area of contact between two structures can be determined by measuring the length of the line that separates them. The contour line often provides a direct representation of this boundary, and can be measured with the IP•Measure Global–>Total Line Length routine. The example shows the contour line separating the two phases in a metal.
Original MonoLyr2 image Contour line separating the phases
4.B. Marking features manually
4.B.1. Region growing
In some situations, a “wand” approach allows human interaction to select features for measurement, or background (which is often more uniform than the features). Clicking on one point selects all pixels within the chosen tolerance (the range of red, green and blue intensities for a color image) that are connected by a continuous selected path to the original point. Then Select–>Similar can be used to include other locations with the same range of colors.
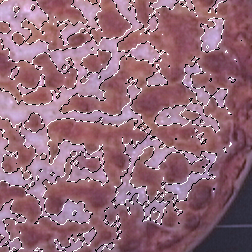
A portion of the Pizza1 image with the uncooked cheese selected using the wand
The wand is also useful for selecting regions to be fit as background (as discussed in Section 2.C.1). Depressing the shift key allows clicking on additional areas to be added to the selection, which need not be continuous. Turn off “anti-aliased” in the tool preferences bar so that pixels are not partially selected.
4.B.2. Manual lines, points, etc
It is also possible for the user to mark lines, points, circles, or other features onto the image which are counted and/or measured, when it is impractical to process the image to permit thresholding and automatic measurements. It is generally wise to select a bright color (for grey scale images) or black or white (for color images) so that the marks are easily visible, and to keep the marked image as a record of what was done. In the example, lines were drawn on the image to mark the size of organelles that are not distinct in stain density nor completely delineated in the section. Once these lines were drawn, the IP•Threshold–>Isolate Pen Color function erases everything except the lines, which can then be measured as shown in Section 6. Similarly, marking features of interest with a colored pencil (with a size large enough for easy visibility) permits counting of features that can be visually recognized even if they cannot be easily processed for thresholding.
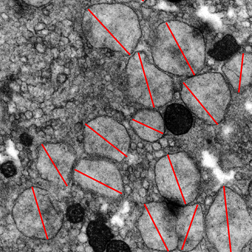
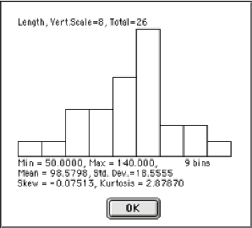
TEM3 image (fragment) with manual lines superimposed Length distribution of the lines