Navigation : Home : FoveaPro : FoveaPro Tutorial : Part 4
Image Analysis Cookbook 6.0: Part 4
2.B.3. Periodic noise removal
Electronic interference, vibration, halftone and moiré patterns superimposed on images are another form of noise. This non-random or periodic noise is most efficiently removed in Fourier transform space, where the periodic information spread throughout the image is represented by a single point for each frequency and orientation. The relationship between the spatial or pixel domain and the Fourier transform power spectrum is shown in the illustration below. The original image was created by superimposing three sets of sinusoidal lines. The power spectrum shows three corresponding points (each plotted twice, symmetrically). Removing one point or “spike” with a filter removes just the corresponding lines, leaving the others intact. In the displayed power spectrum, the location of a spike represents the orientation angle and frequency of the lines, and the darkness of the point is proportional to the log of the amplitude.
The procedure shown is to transform the image with IP•Fourier–>FFT (Forward) , manually mark with the pencil tool a black spot that covers the dark spike in the power spectrum display (it is only necessary to mark one of the two corresponding points, and then select IP•Fourier–>Generate Symmetric Filter to mark the second). Next, threshold this to create a filter or mask (the words are often used interchangeably for this purpose), invert the mask ( Image–>Adjustments–>Invert ) so that it will erase the spikes and preserve all of the other values, and then use IP•Fourier–>Apply Filter and FFT (Inverse) to transform the data without the selected frequency and orientation back to the spatial domain. Automatic methods for locating and removing the spikes will be introduced below.
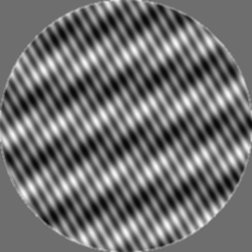
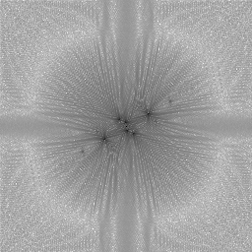
Original ThreeSin image and its Fourier transform power spectrum

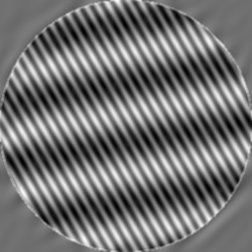
The mask used to remove one of the three sets of lines, and the result
of applying it and performing the inverse FFT transform.
Note that the Fourier transform implementation in the plug-ins requires that the image have dimensions that are an exact power of 2 (64, 128, 256, 512, 1024...). If your image is not that size, you may either use a rectangular marquee with dimensions set to those values to process a portion of the image, or use the Image–>Canvas Size tool to surround the image with padding to the next larger size.
Fourier transforms are not limited in usefulness to images with periodic noise. Processing in Fourier space can be used to implement high- and low-pass filters (the low-pass filter was introduced above in the discussion of noise removal) by removing or emphasizing selected frequency ranges. In the example shown, reducing the high frequencies produces a blurred result identical to a Gaussian filter, while emphasizing them produces a result like the Laplacian and sharpening filters that will be introduced below. The IP•Fourier–>Generate Bandpass Filter plug-in was used to create filters which were then applied just as in the example above (the sliders may be interpreted in much the same way as the equalizer in a music system). In many cases it is more efficient to implement such filters with Fourier transforms even though they may be described in terms of kernels of weights applied to the pixel image.
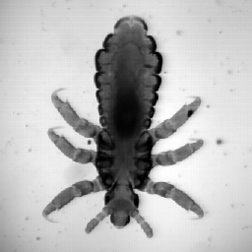
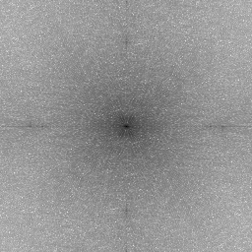
Original Bug image and its Fourier transform.
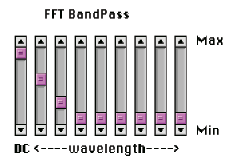
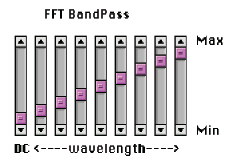
Using the IP• Fourier–>Generate Bandpass plug-in to create low and high pass filters, respectively.

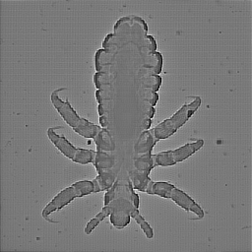
Results of applying the low- and high-pass filters to the image.
The next example combines both of these types of filters to remove the halftone pattern. The original image (scanned from a newspaper) consists of discrete black dots, which create a visual impression of greyscale because their size varies. The Fourier transform power spectrum shows a regular array of spikes that represent the orientation and spacing of the sinusoids that combine to create the dot array. It would be possible to manually mark these spots as was done above, or to mark just two of them and use the IP•Fourier–>Generate Harmonics function, but in this case an automatic method using the top hat filter (described in a following section) was used to locate the spikes and create the mask. Applying the mask to the stored Fourier transform ( IP•Fourier–>Apply Filter ) removes the spikes. In order to fill in the spaces between the original halftone dots, a low pass filter is needed. In this example a Butterworth filter was generated ( IP•Fourier–>Generate Filters ) and applied to the stored transform. Performing the inverse transform with the IP•Fourier–>FFT (Inverse) function produces a result that reveals fine details that are present in the original but visually obscured by the halftone printing process.
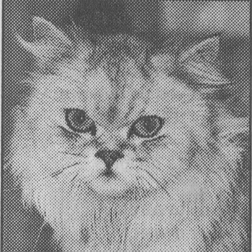
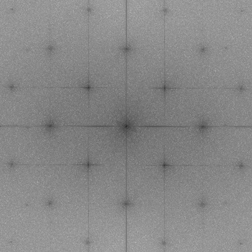
Original Halftone image Fourier transform showing array of spikes


Mask to eliminate spikes ( Halft_1 image ) Butterworth low-pass filter (cutoff = 0.4, Halft_2 image)
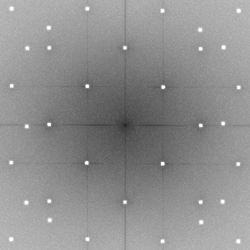
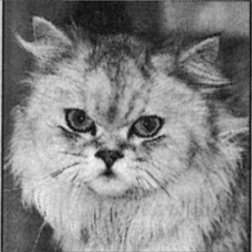
FFT power spectrum after filters are applied Result after inverse transform
If this technique is applied to a color halftone image, it is necessary to process each color channel separately (usually in CMYK mode, since those are the inks used for color printing) because the halftone patterns used for each channel have different orientations.
For images in which the structure is periodic, with superimposed random noise, the same methods can be used except that the filter or mask is inverted to remove everything except the periodic information. In the example, the lines of spikes in the Fourier transform are used to make a mask by leveling the image of the power spectrum (discussed below), followed by thresholding. Then IP•Fourier –> Apply Filter and FFT (Inverse) clarifies the periodic structure of the woven cloth and suppresse s the random variations.
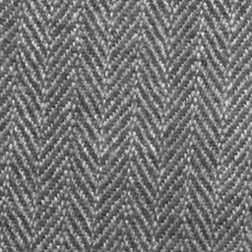
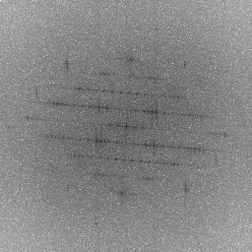
Original Herringbone image Fourier transform
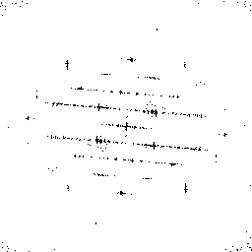
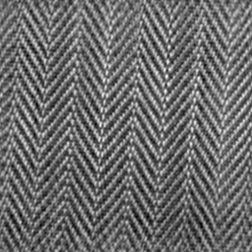
Filter produced by leveling and thresholding Inverse transform showing periodic structure