Navigation : Home : FoveaPro : FoveaPro Tutorial : Part 12
Image Analysis Cookbook 6.0: Part 12
3.F.1. Alignment
The automatic shifting of one image to best align with a second, shown above in section 3.D.2, does not deal with rotation or changes in scale between images. Comprehensive alignment and registration tools for images consisting of either different color channels, serial sections, etc., may be performed manually or automatically, either based on the image contents or on discrete fiducial marks. Proper alignment is required for all procedures that combine multiple images. The use of the Photoshop layers capability for manual alignment is recommended.
3.F.2. Subtraction and ratioing
Combining multiple images by subtraction or ratioing, and displaying the results in RGB or HSI color channels, is an effective way to eliminate lighting variations on curved surfaces, thickness variations in sections, variations in stain concentration, etc. It also makes it easy to display differences that might otherwise be overlooked. Of all these techniques, subtraction is the most commonly used.
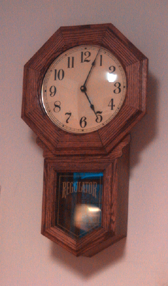
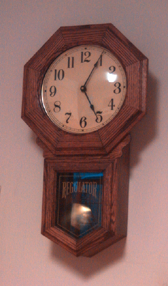
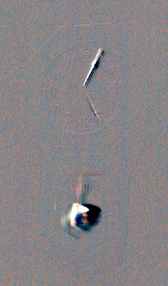
Original C_503 and C_505 images, and their difference
The example shows two images taken at different times, and the result of subtracting one from the other. Small details such as the movement of the hour hand are easily seen in the difference image that are not detectable from side-by-side comparison. To perform subtraction, place either image in the second image memory, click on the other image to make it front-most, and select IP•Math–>Subtract . Other functions, such as ratio ( –>Divide ) or absolute difference ( –>Abs.Diff ) are handled in the same way.
Examples of combining images in different color channels were shown in Sections 2.A.3 and 3.E.1. The following example combines the use of arithmetic combination with color channels for display. The two original images show fura-stained tissue illuminated by 340 and 385 nm wavelength light (which straddle the absorption edge of the stain). The ratio of the two images reveals the extent of calcium activity in the tissue. The sum of the two images is used to represent the amount of stain in each location. Finally, the ratio image is inserted into the hue channel of a composite to produce a color representation in which intensity shows the amount of stain and color represents activity.
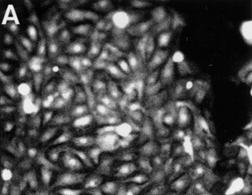
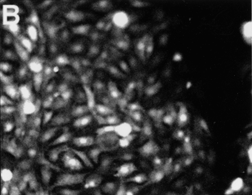
Original Fura_340 and Fura_385 images
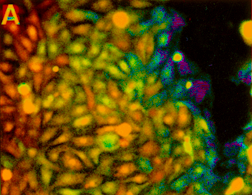
Resulting color composite
Keeping the brightest or darkest pixel values in a sequence can be useful to track moving features as shown in the example. In the final composite image, the track of each feature may be thresholded and measured. This type of image combination is also useful to combine multiple images with different light source positions to fully illuminate irregular surfaces.
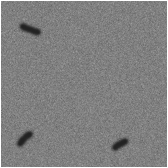
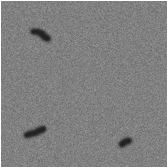
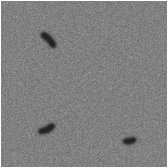
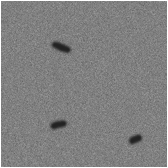
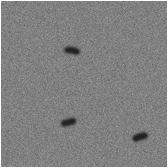
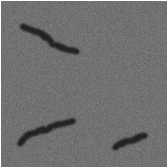
The five images Track_1, 2, 3, 4, 5 and the composite produced by keeping the darker value at each point
3.G. Summary of image processing procedures
Image processing may be done for several reasons: improving the visual appearance of images to aid in detecting and observing important details; preparing images for publication, to effectively communicate to others who are less familiar with the subject; producing some measurement information directly, often by analysis of the histogram; and preparing images for thresholding so that other quantitative measures can be obtained. It may be helpful to summarize the classes of operations as follows:
Global functions (treat every pixel independent of its surroundings)
Histogram modification (stretching, gamma adjustment, equalization, inverting)
Math (add, subtract, multiply, divide, brighter, darker, absolute difference)
Leveling (remove background obtained by measurement, fitting, processing)
Color plane manipulation (merging, separating, converting, transferring)
Neighborhood operations (treat each pixel in the context of its immediate surroundings)
Convolution kernels (smoothing, sharpening, derivatives)
Ranking operations (median, brightest, darkest, range)
Statistical operations (variance, entropy, maximum likelihood)
Local equalization (compare pixel values and adjust local contrast)
Fourier-space functions (treat the image as being composed of multiple frequencies and orientations)
Removal of specific frequencies (high-pass, low-pass, periodic noise removal)
Averaging of periodic structures
Deconvolution for defocus correction
Cross-correlation (locates features)
Understanding this relatively short list of function classes, and developing enough experience with them to be able to visualize and predict what each will do to a given image, prepares the user to efficiently handle a wide variety of image analysis tasks.
4. Thresholding of image features
4.A. Thresholding using the histogram
4.A.1. Manual settings
It is assumed throughout this section that whatever processing is needed, e.g. to level contrast across an image or to convert texture to brightness, has already been performed. Manual interactive setting of thresholds by moving a slider on the histogram can be used to produce binary and contour images, which define the pixels that represent the features to be measured. This is the step where most image measurement errors arise, because of inconsistent human judgment. Adjusting the slider until the result “looks right” is a quick procedure but may be difficult to replicate on another day, or another image, or by another person.
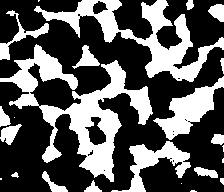
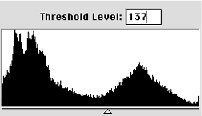
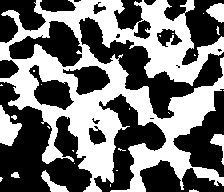
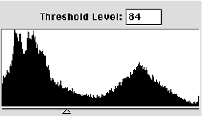
In the example, threshold settings over a considerable range produce visually plausible results, but the area fraction (which measures the volume fraction) of the dark phase varies by about 10%, and simple (but ultimately meaningless) rules such as “pick the lowest point” or “halfway between the peaks” do not produce a correct result, or even one that is consistent for a sequence of images.
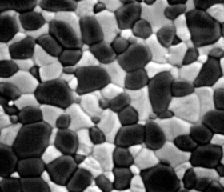
Original Zirconia image. Setting the manual threshold value (in Image–>Adjustments–>Threshold ) to two extreme values as shown below produces area fractions of 65% and 55% for the dark phase, respectively.